Spend Analysis Dashboard
Roopesh
How to Interpret Power BI Visuals
Each visual in this dashboard serves a unique purpose. Here’s how to interpret them as a consultant:
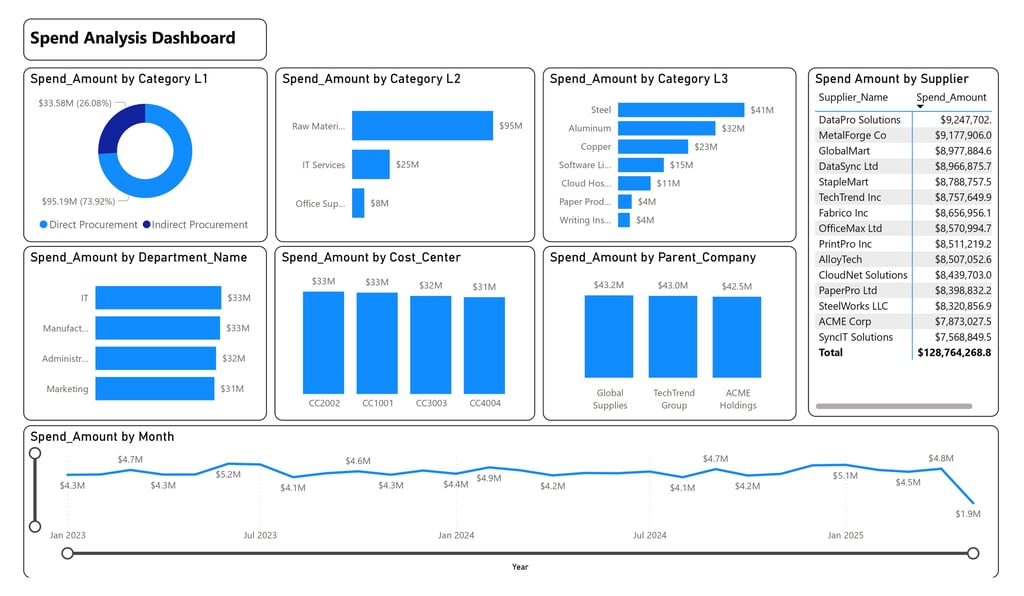
Pie Chart (Spend Amount by Category L1):
Purpose: Shows proportions of a whole.
Interpretation: The larger slice (Indirect Procurement at 73.92%) indicates where most money is allocated. Use this to prioritize cost reviews—indirect spending often has more room for optimization.
Horizontal Bar Charts (Categories, Departments, Cost Centers, Parent Companies):
Purpose: Compare values across categories.
Interpretation: Longer bars (e.g., Raw Materials at $95M) highlight top spend areas. Compare bars to spot outliers or areas for cost reduction, like the $8M on office supplies.
Table (Spend Amount by Supplier):
Purpose: Provides exact values for detailed analysis.
Interpretation: Focus on top suppliers like DataPro Solutions ($29.25M) to negotiate better terms. The total spend ($128.76M) is a benchmark for overall budget tracking.
Line Graph (Spend Amount by Month):
Purpose: Tracks trends over time.
Interpretation: Look for patterns—peaks like $5.1M in Mar 2025 suggest high activity, while the dip to $1.9M in Jun 2025 warrants investigation for potential issues or savings.
Actionable Recommendations
Optimize Indirect Procurement: With $95.19M (73.92%) in indirect spending, review areas like IT services ($25M) and office supplies ($8M) for cost-saving opportunities, such as bulk purchasing or vendor consolidation.
Investigate Raw Materials Costs: The $95M spend on raw materials, especially steel ($41M), is significant. Explore alternative suppliers or negotiate better rates to reduce costs.
Address the Jun 2025 Drop: The $1.9M spend in Jun 2025 is the lowest in the period. Confirm if this reflects a strategic reduction, incomplete data, or an operational issue.
Diversify Suppliers: Spending is concentrated with a few parent companies (e.g., Global Supplies at $43.2M). Diversify to mitigate risks of supply chain disruptions.
Leverage Power BI Interactivity: In Power BI, you can click on visuals (e.g., "IT" in the department chart) to filter related data. Use this to drill deeper into specific areas, like IT’s $33M spend.