Case study 01 · Worked illustrative example
Business Performance Intelligence
Business question: Which monthly performance gaps deserve attention first, and what should a management team investigate next?
Data status: synthetic and illustrative. All rows and values are created for this example. The result demonstrates a calculation and analysis workflow; it is not a verified result from a company, client or employer.
1. Download the sample data
The CSV sample dataset contains the KPI, target, actual, unit and whether a higher value is favourable. Use it to reproduce the calculations below.
2. Results from the synthetic sample
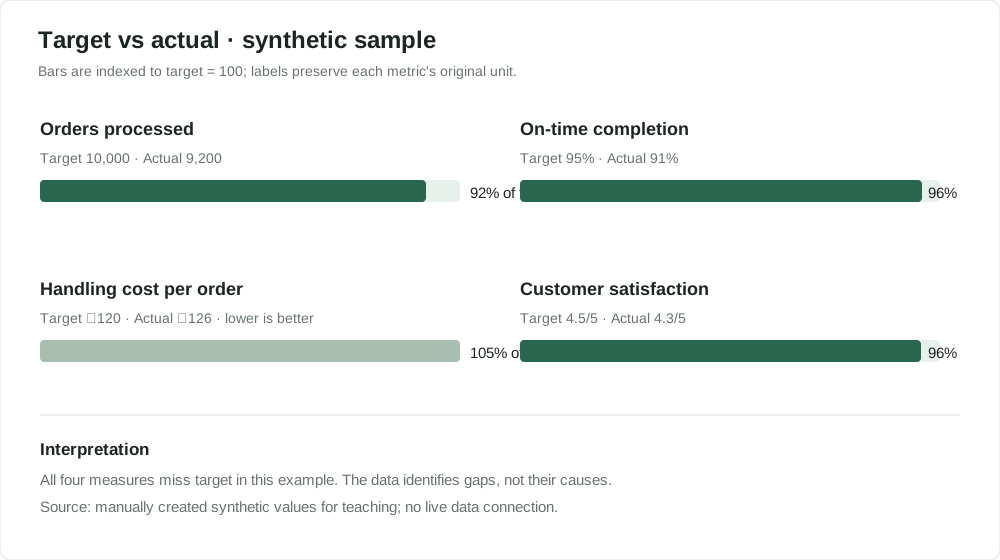
| KPI | Target | Actual | Absolute variance | Interpretation |
|---|---|---|---|---|
| Orders processed | 10,000 | 9,200 | -800 | 8% below target |
| On-time completion | 95% | 91% | -4 percentage points | Below target |
| Handling cost per order | ₹120 | ₹126 | +₹6 | 5% above target; higher cost is unfavourable |
| Customer satisfaction | 4.5/5 | 4.3/5 | -0.2 points | Below target |
For count and cost measures, relative variance is (actual − target) / target × 100. Rate changes are shown in percentage points, and rating changes in rating points. The unit and direction matter: a positive cost variance is not a favourable result.
3. Reproduce the analysis with SQL
The query assumes a table named monthly_kpis with columns kpi_name, target_value, actual_value and favourable_direction. The schema is illustrative; load the CSV into a table with these columns first.
SELECT
  kpi_name,
  target_value,
  actual_value,
  actual_value - target_value AS variance,
  CASE
    WHEN target_value = 0 THEN NULL
    ELSE ROUND(100.0 * (actual_value - target_value) / target_value, 2)
  END AS relative_variance_pct,
  favourable_direction
FROM monthly_kpis
ORDER BY ABS(actual_value - target_value) DESC;
The query ranks absolute numerical differences. This is useful for triage, but not sufficient for priority-setting because units differ. A rigorous priority model also considers business impact, risk, confidence in evidence, and effort.
4. What this sample tells us
The sample shows four misses against target. It does not explain why they occurred. The next useful step is to segment orders and on-time completion by region, day, order complexity or team, then test whether the same segments also have higher costs or lower satisfaction. These are hypotheses to test, not established causes.
5. Assumptions and limitations
- The data are fictional and small; values are manually chosen for teaching.
- Targets are treated as agreed and comparable with actuals for the same period.
- There is no row-level transaction data to verify the figures or perform a true driver decomposition.
- The example does not prove a causal relationship between throughput, cost, timing and satisfaction.
- The chart is a static teaching visual; no live data or dashboard refresh is connected.
- Relative variance can be misleading across units, so the analysis shows percentage points for rates and rating points for customer satisfaction.
6. Suggested management follow-up
- Validate metric definitions, data completeness and reporting period.
- Locate the largest operational gaps by meaningful segments.
- Test potential drivers rather than assume causes.
- Assign an owner, due date and follow-up metric to each investigation.
- Revisit the scorecard after actions are taken and record whether the gap changed.
7. Practice exercise
Orders target 10,000 and actual 9,200. Calculate absolute and relative variance.
Answer: Absolute variance = 9,200 − 10,000 = −800 orders. Relative variance = −800 / 10,000 × 100 = −8%.
Last updated: 17 October 2026